Saving: How much of your income should you save? What people manage
Save 20% of your take-home pay if you can, and a smaller share you can keep every month if you can't, even 5%. That's the usual answer to how much of your income you should save. Most households save far less: in the US, the rate was 4.1% of after-tax income in August 2026.
 By Wealtie Team · 4 min read
Key takeaways
- The usual target is 20% of take-home pay, from the 50/30/20 rule, and it covers emergency savings, retirement and paying debt down faster than the minimum.
- US households saved 4.1% of disposable income in August 2026; UK households saved 8.8% and euro-area households 14.2% in April to June 2026.
- On $3,000 a month of take-home pay, saving 20% is $600 a month, which puts one month's pay aside in five months.
- If 20% doesn't fit, start at 5% or 10% and add a point or two each time your pay rises.
- In the Federal Reserve's 2025 survey, 55% of US adults had money set aside to cover three months of expenses.
What percentage of income should you save?
20% of your take-home pay is the usual target.
It comes from the 50/30/20 rule: half your pay for needs, 30% for wants and 20% for savings and for paying debt down faster than the minimum. Take-home means what lands in your account after tax. If pension contributions come out of your pay before you see it, they already count toward the 20%.
The rule assumes needs fit in half your pay. If rent and bills take 60% or 70%, change the split instead of dropping the plan: 60/20/20 keeps savings at 20% by cutting wants, and 70/20/10 keeps something going in a tight year.
How much do people actually save?
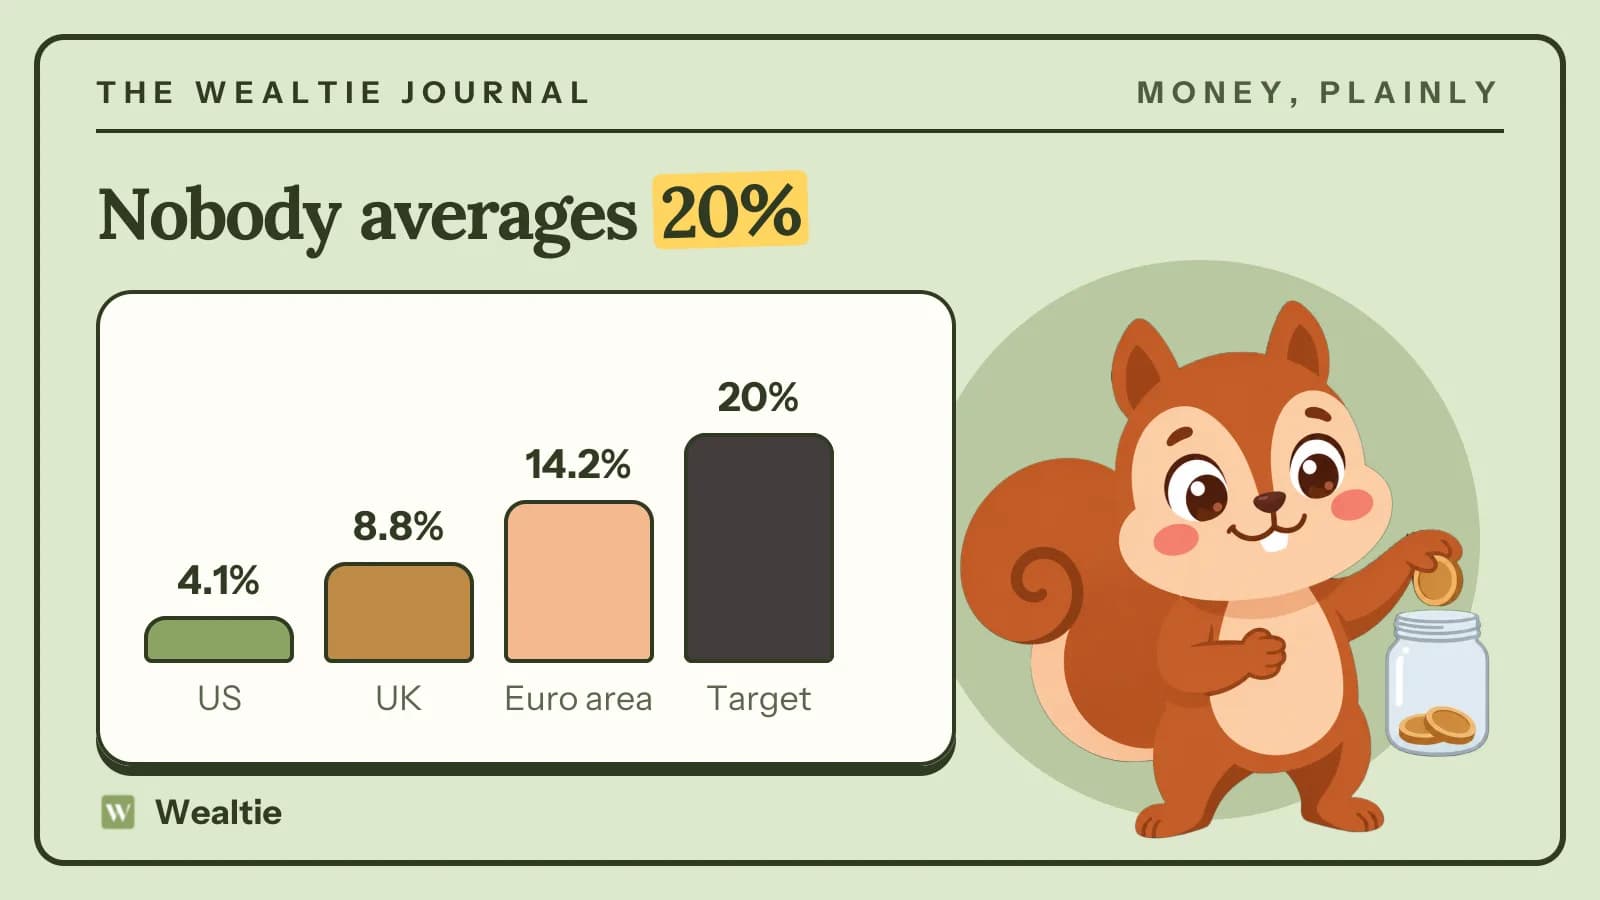
Much less than 20%. The latest national figures are 4.1% in the US, 8.8% in the UK and 14.2% in the euro area.
Each country's statistics office publishes a household saving rate: the share of after-tax income that households didn't spend.
- United States: the personal saving rate was 4.1% of disposable income in August 2026, according to the Bureau of Economic Analysis.
- United Kingdom: the household saving ratio rose 0.2 percentage points to 8.8% in April to June 2026, according to the Office for National Statistics.
- Euro area: the gross household saving rate was 14.2% in April to June 2026, down from 14.4% in the first quarter, in Eurostat's quarterly sector accounts.
Here's what each rate means on 3,000 a month of take-home pay, in whatever currency you're paid in:
| Where | Saving rate | Period | Saved on 3,000 a month |
|---|---|---|---|
| United States | 4.1% | August 2026 | 123 |
| United Kingdom | 8.8% | April–June 2026 | 264 |
| Euro area | 14.2% | April–June 2026 | 426 |
| 50/30/20 target | 20% | — | 600 |
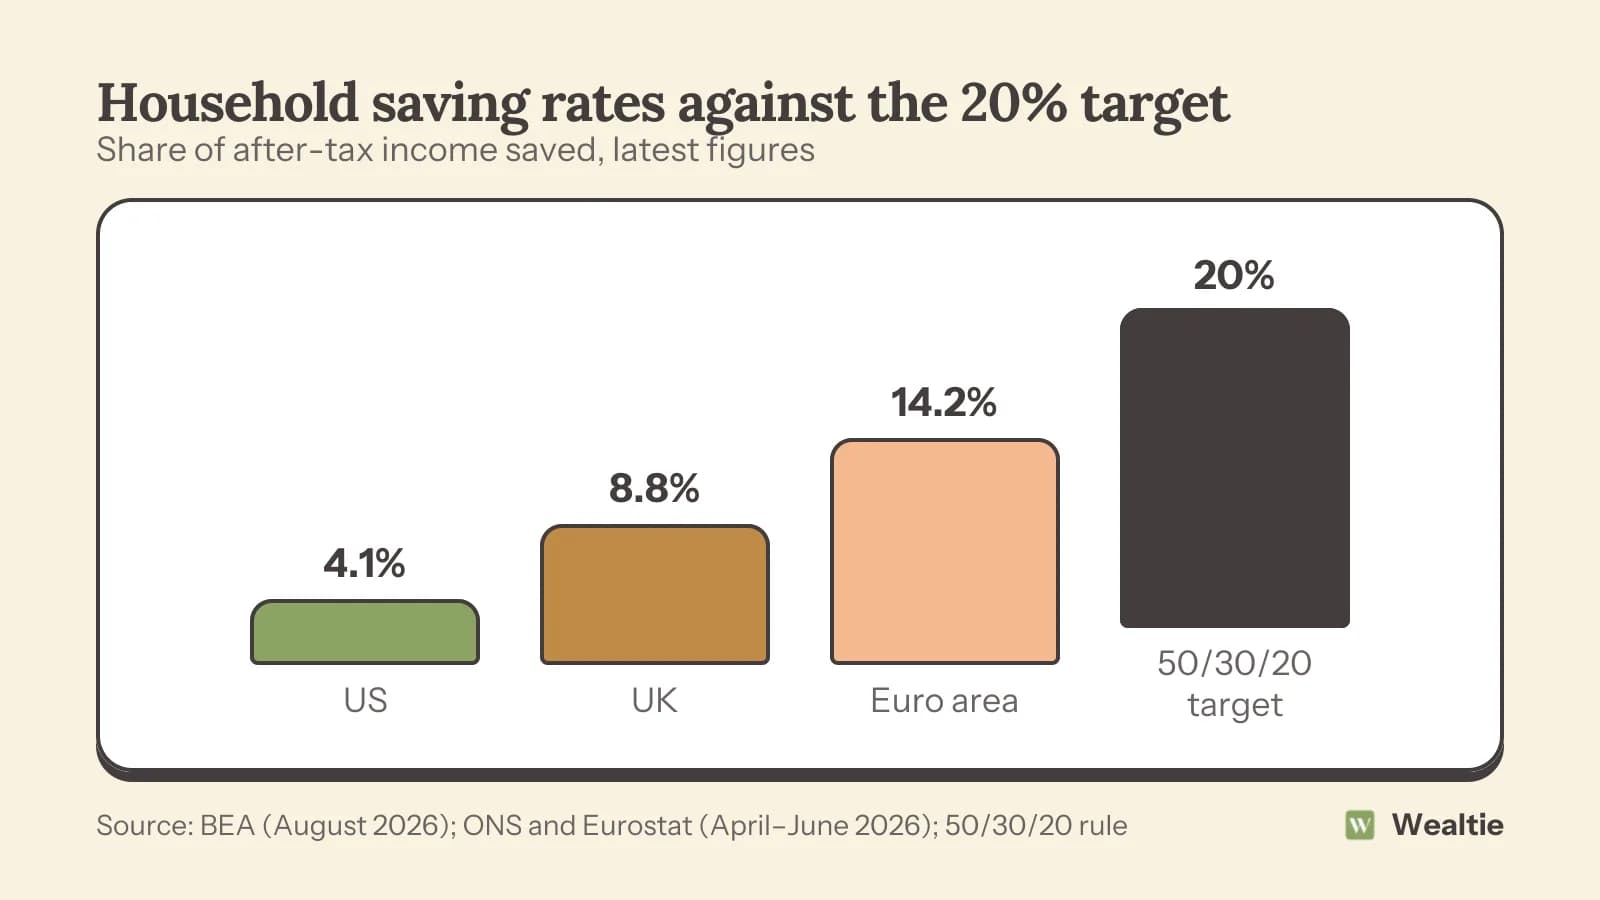
The three offices don't measure it the same way. The UK and euro-area rates add pension saving to the income they divide by, and Eurostat's figure is a gross rate, counted before depreciation. Treat the gaps between countries as rough. All three averages sit well under 20%.
An average also hides the spread. In the Federal Reserve's 2025 Survey of Household Economics and Decisionmaking, 55% of US adults had set aside money for three months of expenses. That's unchanged from 2024 and down from 59% in 2021.
How much of your income should you save each month?
Multiply your monthly take-home pay by the share you pick. 20% of $3,000 is $600.
On $3,000 a month:
| Share saved | Per month | Per year | Months to save one month's pay |
|---|---|---|---|
| 5% | $150 | $1,800 | 20 |
| 10% | $300 | $3,600 | 10 |
| 15% | $450 | $5,400 | 7 |
| 20% | $600 | $7,200 | 5 |
The last column matters because one month's pay is the first target in how much should be in an emergency fund. At 5% it takes most of two years. At 20% it takes five months.
Paid every two weeks? Divide the yearly amount by 26 paychecks: $7,200 a year is $276.92 a paycheck. To try your own take-home figure, use the budget calculator.
What should your savings go to first?
An emergency fund of one month's pay, then the bills you know are coming, then everything longer.
- One month of take-home pay in a separate account. It covers the surprise bill that would otherwise go on a card. The emergency fund calculator shows how many months each target takes at your saving rate.
- A sinking fund for yearly costs like car insurance, a yearly subscription or a holiday, so they don't wreck one month a year. What is a sinking fund shows how to work out the monthly amount.
- Three to six months of essential costs, the fuller emergency fund.
- Longer goals: a deposit, paying debt down faster than the minimum, or more for retirement.
Pension contributions taken from your pay keep running alongside all of this. They're part of the 20%, so if 5% of your pay already goes to a pension, the share you move by hand is 15%.
What if you can't save 20%?
Start with a share you can keep every month, and raise it when your pay goes up.
5% of $3,000 is $150 a month, or $1,800 by the end of the year. Move it on payday and keep the amount the same for three months before you judge it. Each time your pay rises, add a point or two to the share before the extra money gets absorbed into spending.
If even 5% doesn't fit, start with last month's spending. The categories that change from month to month are where saving money comes from, and how to stop overspending goes through them one by one.
On an income that changes from month to month, save a share of each payment as it lands and plan around your lowest normal month. The guide on how to budget on irregular income sets that up.
Should you save from gross or net income?
Work it out from net pay, the amount that reaches your account after tax.
That's what the 50/30/20 rule uses, and it's the base the national saving rates use too: disposable income is income after tax. On a $45,000 salary with $36,000 of take-home pay, 20% of gross is $9,000 a year and 20% of net is $7,200. Pick one base and keep it, so this month's rate compares with last month's.
If you're self-employed, tax isn't taken out before the money arrives, so set it aside first and save from what's left. How much to set aside for taxes when you're self-employed has the rates.
How do you keep the saving rate going?
Move the money on payday, set your spending limit to what's left, and check the rate once a month.
The transfer goes first, on the day your pay lands. Track it as a transfer between your own accounts, not as spending, or your budget looks $600 worse than it is. Wealtie's net worth tracker keeps card, cash and savings in one total, and a transfer between accounts never counts as spending.
Then the spending limit is take-home pay minus savings: $2,400 on $3,000 at 20%. A budget tracker that forecasts the month catches the overspend before it eats the savings. Wealtie's Budget Health warns you mid-month if your spending pace will take you over.
Once a month, divide what you moved to savings by what you took home. That's your saving rate. If it slipped, the spending categories from that month show where.
Questions people ask
20% of take-home pay is the common target, from the 50/30/20 rule. It covers emergency savings, retirement and paying debt down faster than the minimum. If that doesn't fit yet, start at 5% or 10% and raise it as your pay rises.
Multiply your monthly take-home pay by the share you're saving. On $3,000 a month, 10% is $300 and 20% is $600. Pick the share first and the monthly amount follows.
Divide your yearly savings target by the number of paychecks. On $36,000 a year of take-home pay, paid every two weeks, 20% is $7,200 a year or $276.92 a paycheck.
10% is a solid start, more than double the 4.1% US households saved in August 2026. On $3,000 a month it puts one month's pay aside in ten months. Raise it toward 20% as your pay goes up.
Yes. In the 50/30/20 rule the 20% includes retirement contributions, emergency savings and extra debt payments. Pension money taken from your pay before you see it already counts toward it.
US households saved 4.1% of after-tax income in August 2026, according to the BEA. UK households saved 8.8% and euro-area households 14.2% in April to June 2026, though each office measures it slightly differently.
Sources
- Personal Income and Outlays, August 2026 · U.S. Bureau of Economic Analysis · checked 24 October 2026
- Quarterly sector accounts, UK: April to June 2026 · Office for National Statistics · checked 24 October 2026
- Key indicators for sector accounts - quarterly data (nasq_10_ki) · Eurostat · checked 24 October 2026
- Glossary: Household saving rate · Eurostat · checked 24 October 2026
- Economic Well-Being of U.S. Households in 2025: Savings and Investments · Board of Governors of the Federal Reserve System · checked 24 October 2026
This article is general information, not financial, tax or legal advice. Your situation is your own; check the numbers that apply to you before you act on them.